Census 2017 vs 2023 — Zila Profile
Population growth and density by district.
01Business problem
District-level census results needed to be compared across two census years with growth and density.
02Approach
Persons 2017 vs 2023, growth % and density per km² by district with a map and ranking.
03What's inside
- Population 2017 vs 2023
- Growth % and density per km²
- District map and ranking
- District filter
04Insights & outcome
Fast-growing and dense districts are easy to identify for planning.
Need a Tableau report like this for your business?
Send me your data and the questions you need answered. I confirm scope, timeline and a fixed price before any work starts; typical dashboard delivery is 1–3 days.
More in Healthcare & Public Sector
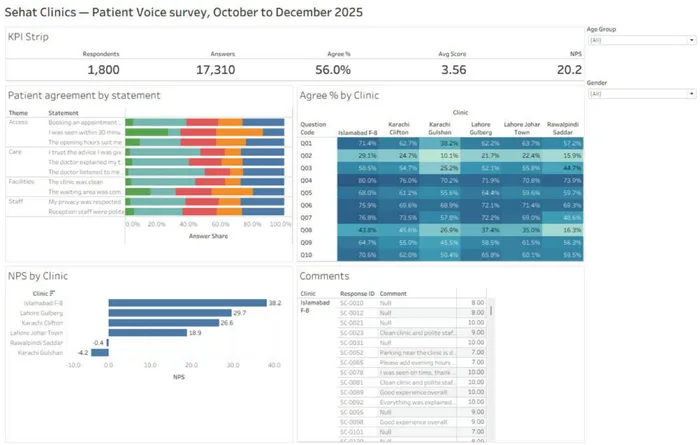
Patient Satisfaction Survey
Patient Voice survey: respondents, agree %, average score and NPS by clinic and age group.
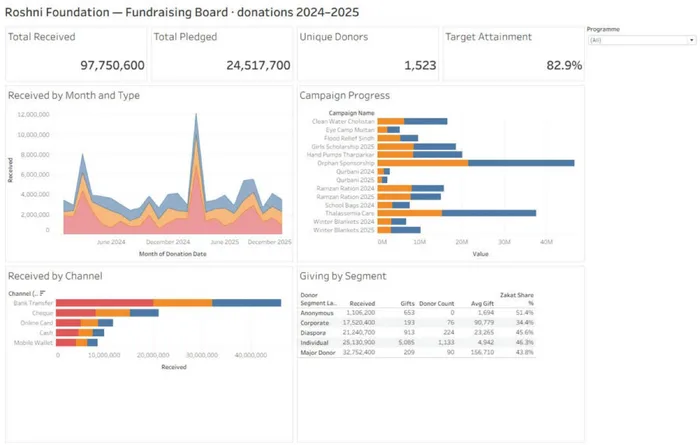
NGO Programme Impact
Fundraising board: total received vs pledged, unique donors and target attainment by programme.
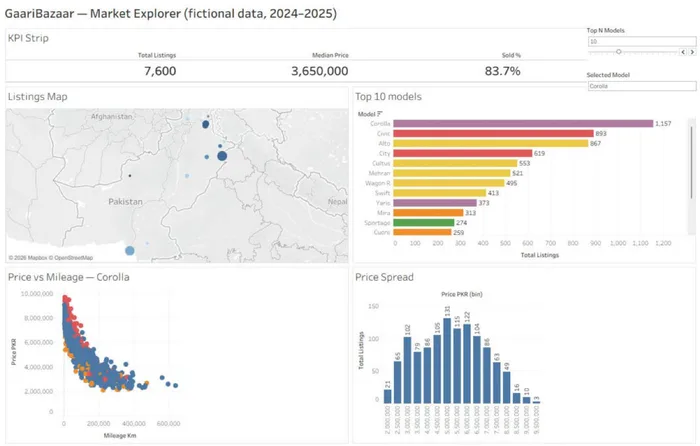
Used-Car Market Explorer
GaariBazaar market explorer: listings, median price and sold % with a Top-N model parameter and interactive filters.