Air Quality Monitoring — Saaf Hawa Network
Station map, city ranking and a daily PM2.5 calendar.
01Business problem
An air-quality network had readings from many stations but no single view that showed where and when air was unhealthy.
02Approach
A station map, city ranking and monthly trend sit above a daily PM2.5 calendar coloured by threshold band, all filtered by month.
03What's inside
- Station days, average PM2.5 and unhealthy-day % KPIs
- Station map with size by reading
- City ranking with threshold colours
- Daily PM2.5 calendar
04Insights & outcome
Worst cities and worst days stand out at a glance.
Need a Tableau report like this for your business?
Send me your data and the questions you need answered. I confirm scope, timeline and a fixed price before any work starts; typical dashboard delivery is 1–3 days.
More in Energy & Environment
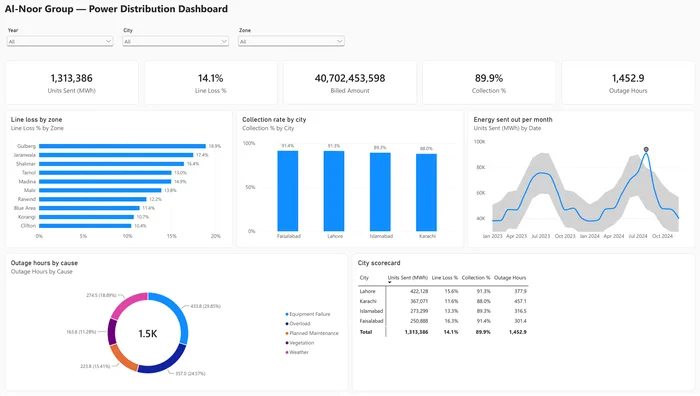
Power Distribution with Anomaly Detection
Daily consumption by site with automatic anomaly detection to flag unusual spikes and dips.
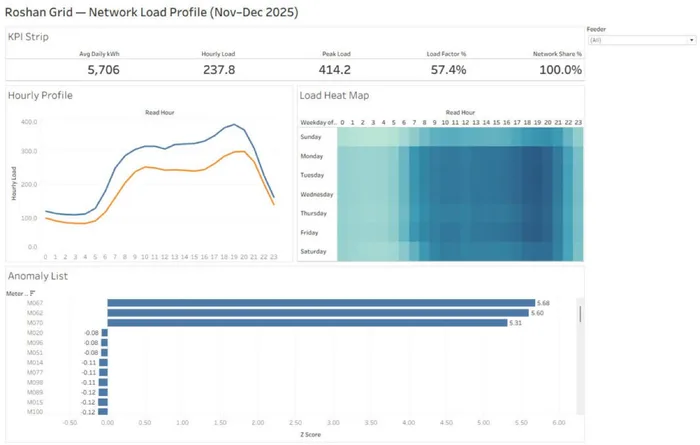
Smart Meter Energy Monitoring
Network load profile: average and peak kWh, load factor and network share by feeder.
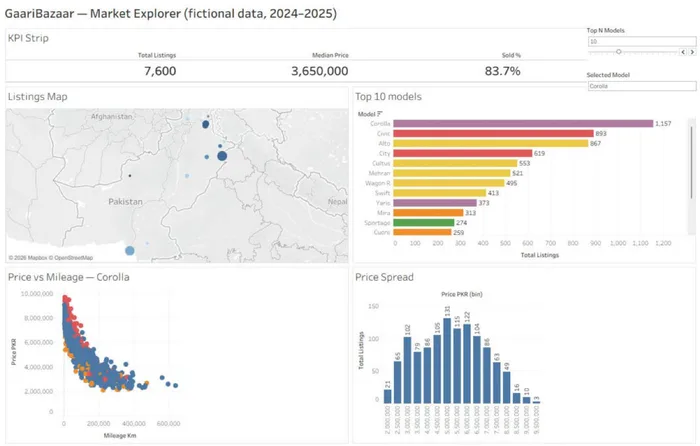
Used-Car Market Explorer
GaariBazaar market explorer: listings, median price and sold % with a Top-N model parameter and interactive filters.