Power Distribution Dashboard with Anomaly Detection
Daily consumption by site with automatic anomaly flags.
01Business problem
Facility teams were spotting faults and waste only when the bill arrived, weeks after the unusual usage happened.
02Approach
Daily consumption per site was modelled as a time series. Power BI anomaly detection highlights spikes and dips automatically with an expected range and explanation.
03What's inside
- Consumption, peak load and cost KPIs
- Anomaly detection on the daily trend
- Site comparison and ranking
- Hour-of-day heat map
04Insights & outcome
Unusual days are flagged the next morning instead of at month-end.
Need a Power BI report like this for your business?
Send me your data and the questions you need answered. I confirm scope, timeline and a fixed price before any work starts; typical dashboard delivery is 1–3 days.
More in Energy & Environment
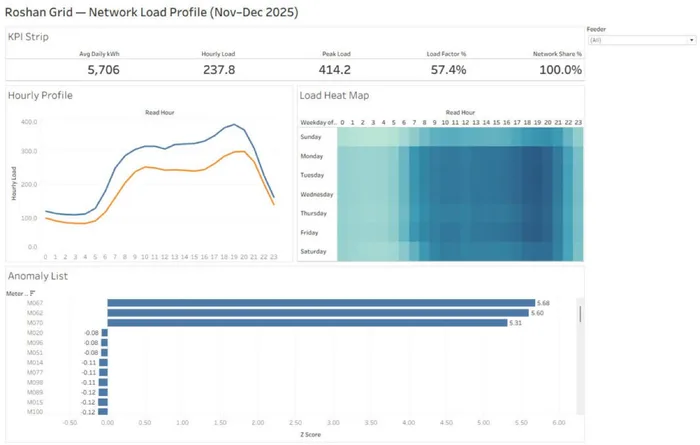
Smart Meter Energy Monitoring
Network load profile: average and peak kWh, load factor and network share by feeder.
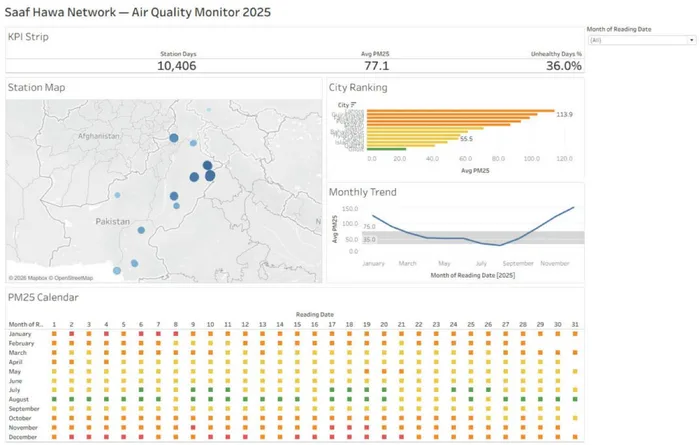
Air Quality Monitoring
Station map, city ranking, monthly PM2.5 trend and a daily calendar of unhealthy days.
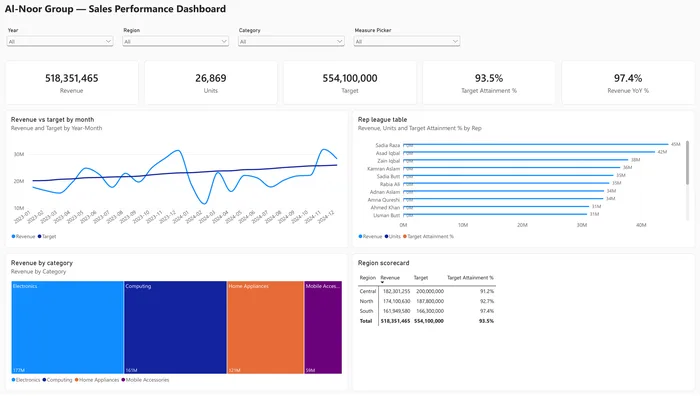
Dynamic Sales Analysis
Field parameters let users switch metric and dimension themselves; KPI cards, trends and drill-through to order detail.