Dynamic Sales Analysis with Field Parameters
One report that answers many sales questions without dozens of pages.
01Business problem
Sales managers wanted to look at revenue, profit and units by region, category and channel, but every new question meant another report page and another request to the analyst.
02Approach
The raw sales export was cleaned in Power Query (type fixes, trimming, unpivoting the monthly columns) and loaded into a star-schema model with a proper date table. Field parameters let the user switch both the measure and the dimension directly on the page.
03What's inside
- Metric switch: Revenue / Profit / Units
- Dimension switch: Region / Category / Channel
- KPI cards with YoY change
- Trend line vs target with month filter
- Drill-through to order-level detail
04Insights & outcome
A single page replaces six static reports; new questions are answered by the user in seconds instead of a request to the analyst.
Need a Power BI report like this for your business?
Send me your data and the questions you need answered. I confirm scope, timeline and a fixed price before any work starts; typical dashboard delivery is 1–3 days.
More in Sales & Marketing
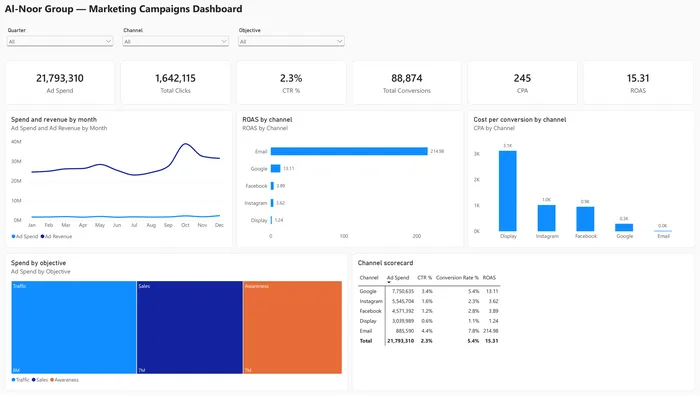
Marketing ROI What-If Simulator
Spend, leads, conversions and ROI by channel, plus a what-if slider to model budget changes before committing.
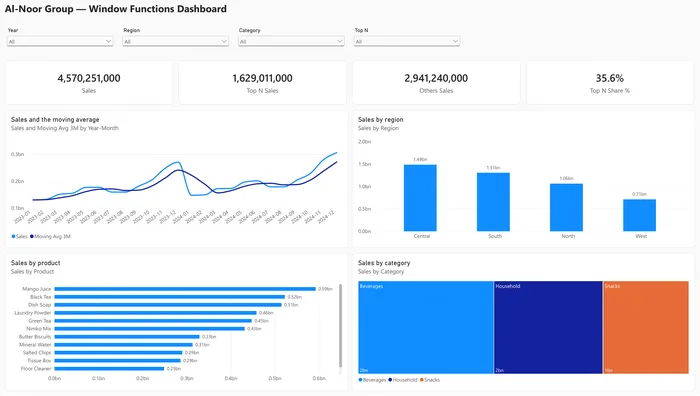
Advanced DAX Window Functions
OFFSET, WINDOW, INDEX and RANK for month-over-month change, running totals and top performers.
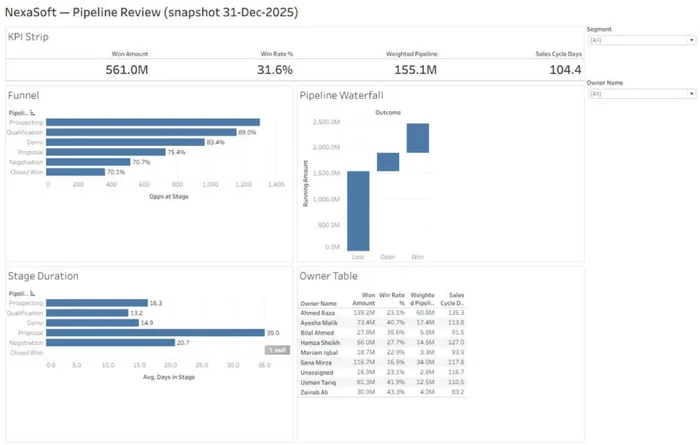
Sales Pipeline & Rep Performance
Pipeline review: won amount, win rate, weighted pipeline and sales-cycle days by segment.