P&L Financial Statement with Calculation Groups
A finance-style Profit & Loss report with time intelligence applied to every line.
01Business problem
Finance needed MTD, QTD, YTD, prior-year and variance views for every P&L line. Writing those as separate measures would have meant 60+ measures that all needed maintaining.
02Approach
A general-ledger extract was mapped to a P&L structure table. Calculation groups (Tabular Editor) apply the time-intelligence logic once to a handful of base measures, so the matrix shows Current, YTD, PY and YoY % for every line from one definition.
03What's inside
- Statement matrix: revenue → gross profit → net profit
- Calculation group: Current, MTD, QTD, YTD, PY, YoY %
- Waterfall from revenue to net profit
- Net profit by department and quarter
- Year and department slicers
04Insights & outcome
Model stays small (5 base measures) and any new time view is a one-line change rather than a rewrite.
Need a Power BI report like this for your business?
Send me your data and the questions you need answered. I confirm scope, timeline and a fixed price before any work starts; typical dashboard delivery is 1–3 days.
More in Finance & Banking
Banking Portfolio with Row-Level Security
Accounts, balances and loans; each branch manager sees only their own branch through RLS.
Dynamic Sales Analysis
Field parameters let users switch metric and dimension themselves; KPI cards, trends and drill-through to order detail.
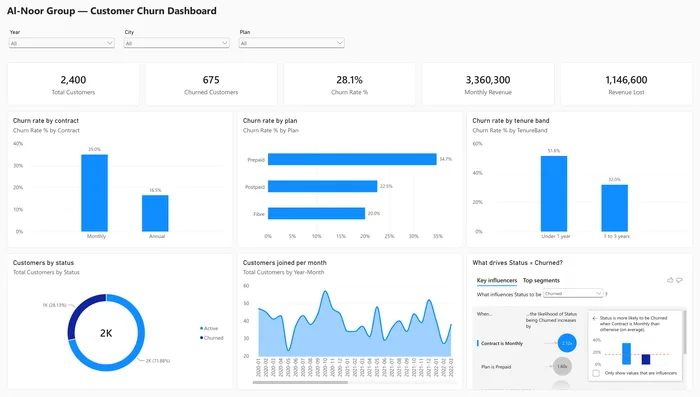
Customer Churn Drivers
Telecom-style churn KPIs with the Key Influencers AI visual showing which factors drive customers to leave.