Tableau · Operations
Event Halls Bookings Calendar — Gulshan Marquees
Bookings Gantt, clash list and hall utilisation.
01Business problem
A venue business was double-booking halls and could not see utilisation by month.
02Approach
A bookings Gantt, a clash list, a calendar heat map and hall-utilisation matrix, filtered by venue.
03What's inside
- Total bookings, value, occupancy %
- Clash and over-capacity flags
- Bookings Gantt by hall
- Calendar heat map and utilisation
04Insights & outcome
Clashes are flagged before they become a problem.
Need a Tableau report like this for your business?
Send me your data and the questions you need answered. I confirm scope, timeline and a fixed price before any work starts; typical dashboard delivery is 1–3 days.
More in Operations
Power BI
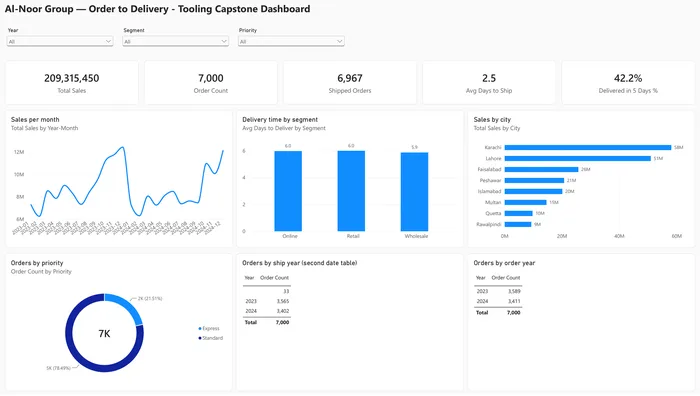
Order-to-Delivery Logistics
Two role-playing date tables, lead-time measures, on-time % and carrier performance.
Tableau
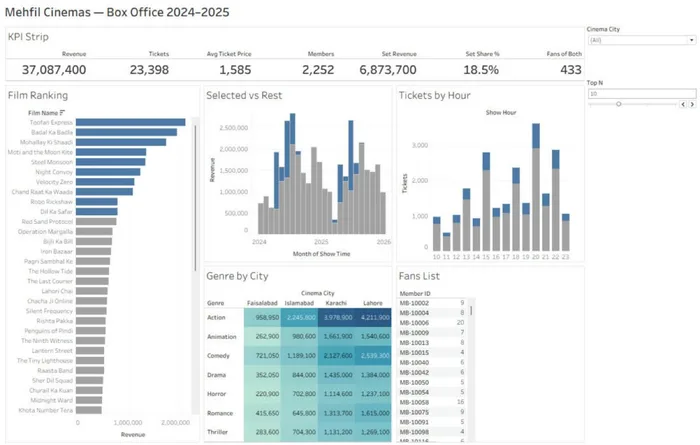
Cinema Box-Office Dashboard
Revenue, tickets, average price, members and set-share across cinema cities.
Tableau
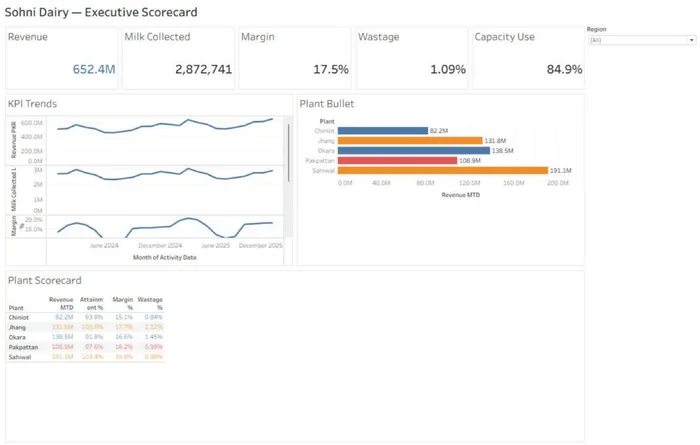
Dairy Farm KPI Scorecard
Executive scorecard: revenue, milk collected, margin, wastage and capacity use by region.