Customer Churn Drivers – Key Influencers
Which factors most increase the chance a customer leaves.
01Business problem
A telecom-style dataset showed churn was rising, but the retention team could not tell whether contract type, tenure or charges were the real driver.
02Approach
Churn rate KPIs and segment breakdowns were built first, then the Key Influencers AI visual was configured against the churn flag to surface the factors (and their relative impact) that most increase churn.
03What's inside
- Churn rate, churned customers and revenue at risk
- Churn by contract type, tenure band and payment method
- Key Influencers AI visual with top segments
- Customer-level detail with drill-through
04Insights & outcome
Month-to-month contracts with short tenure were identified as the highest-risk segment, giving retention a clear starting point.
Need a Power BI report like this for your business?
Send me your data and the questions you need answered. I confirm scope, timeline and a fixed price before any work starts; typical dashboard delivery is 1–3 days.
More in Customer Analytics
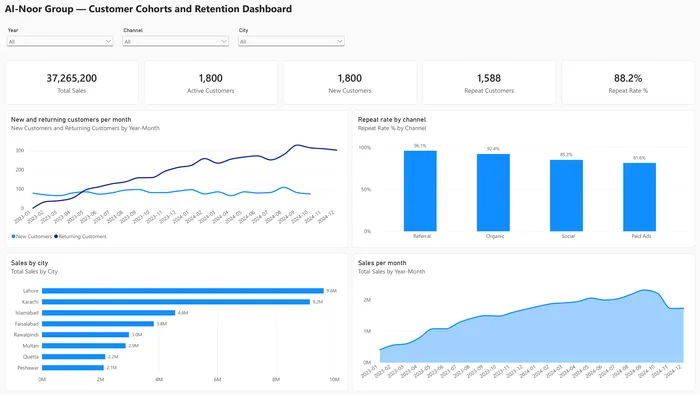
Customer Cohort Retention Matrix
Customers grouped by first-purchase month with a retention heatmap built on DAX cohort logic.
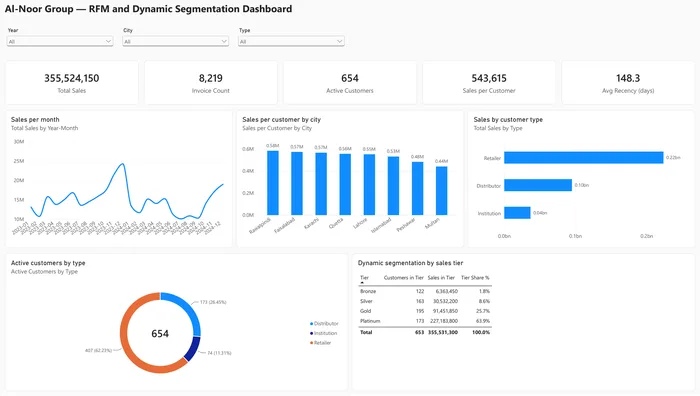
RFM Customer Segmentation
Recency, Frequency and Monetary scores segment customers into Champions, Loyal, At-Risk and Lost.
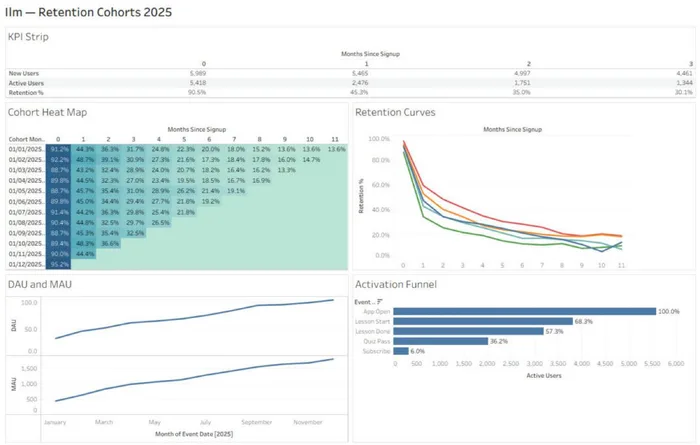
App Retention Cohorts
Signup cohorts with months-since-signup retention triangle and drop-off analysis.