Smart Meter Network Load — Roshan Grid
Average and peak load, load factor and network share by feeder.
01Business problem
A grid operator needed to see which feeders ran close to peak and when.
02Approach
Average daily kWh, hourly load, peak load and load factor with a feeder filter and hour-of-day profile.
03What's inside
- Avg daily kWh, hourly load, peak load
- Load factor and network share
- Feeder filter
- Hour-of-day load profile
04Insights & outcome
Peak-risk feeders are visible before they trip.
Need a Tableau report like this for your business?
Send me your data and the questions you need answered. I confirm scope, timeline and a fixed price before any work starts; typical dashboard delivery is 1–3 days.
More in Energy & Environment
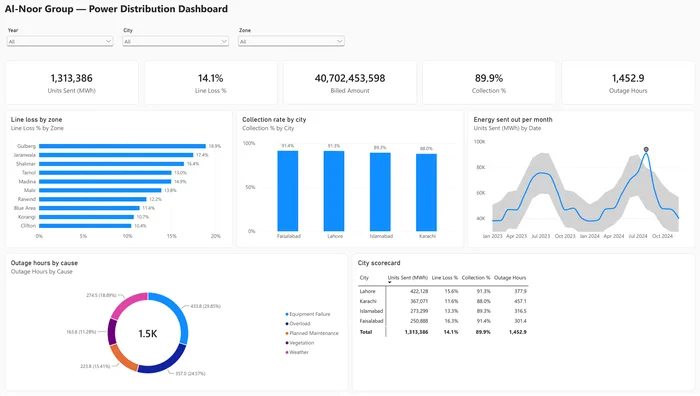
Power Distribution with Anomaly Detection
Daily consumption by site with automatic anomaly detection to flag unusual spikes and dips.
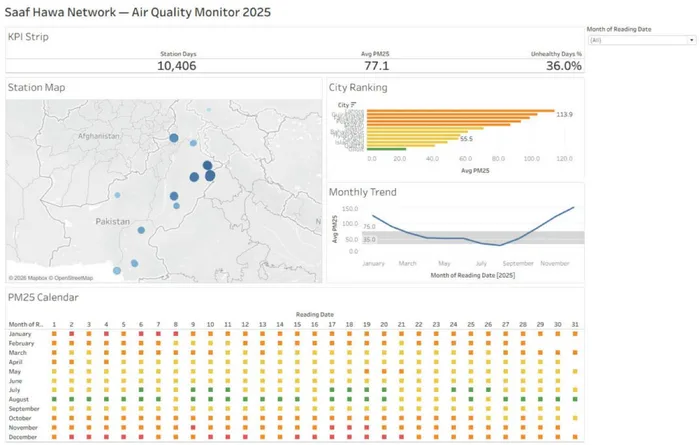
Air Quality Monitoring
Station map, city ranking, monthly PM2.5 trend and a daily calendar of unhealthy days.
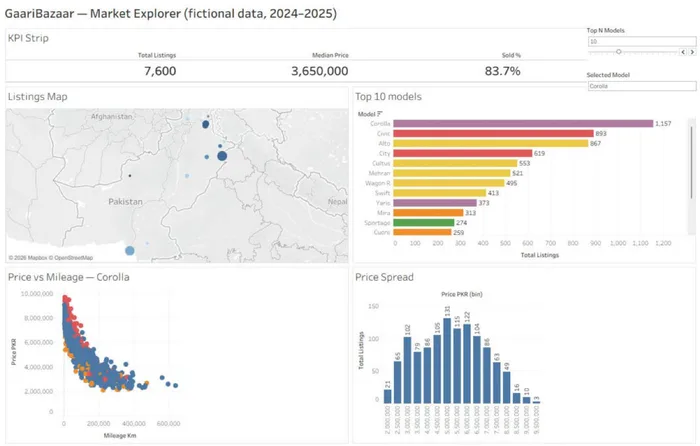
Used-Car Market Explorer
GaariBazaar market explorer: listings, median price and sold % with a Top-N model parameter and interactive filters.